Youtube comments section provide us with a rich source of alternative data, paired with Youtube's easy-to-use API and the wide variety of sentiment analysis and natural language processing packages in Python, there is surely a lot of insights for Youtube channel owners as well as those interested in public opinion for a wide range of reasons. In order to follow along with this post and run the code yourself, you will need to have created a Youtube API key, in the interests of time and space I recommend following this guide rather than us typing out the process here.
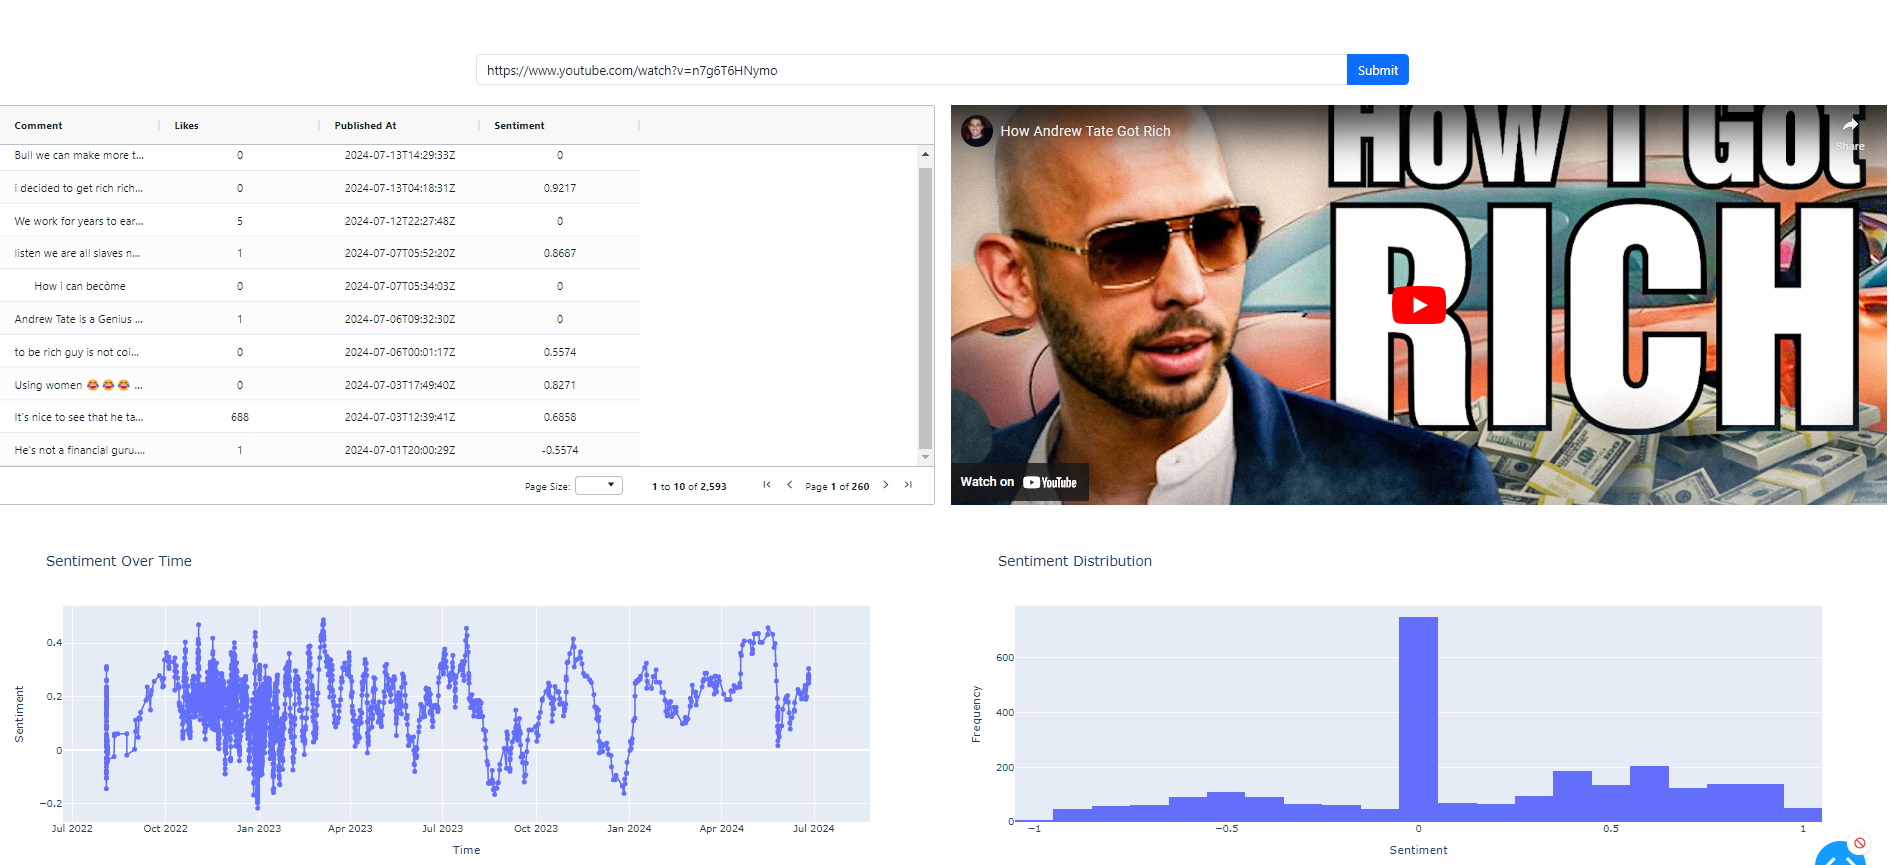
The image below is a snapshot of what we will be creating, essentially we are going to follow the points below to create the Youtube Dashboard.
Contents
- Create a small wrapper around the Youtube API that will pull comments and save them in a Pandas dataframe.
- Perform some basic natural language processing on the comments including sentiment analysis with the vader package.
- Create a Dash-ag-grid example that will allow us to sort the comments by sentiment, likes etc
- Embed an Iframe in to a Ploty Dash application to display a Youtube video within a Dash application
- Plot word counts and types of words in bar charts
Installing Required Packages
Copy and paste the text below in to a file called requirements.txt
pandas
scikit-learn
google-api-python-client
oauth2client
nltk
spacy
python-dotenv
dash
dash-bootstrap-components
vaderSentiment
dash-ag-grid
Once you have activated your virtual environment you can install the packages with
pip install -r requirements.txt
Collecting Youtube Comments with Python
The get_video_comments function retrieves comments from a specified YouTube video using the YouTube Data API. It takes the video ID as input and fetches up to 100 comments per API call, iterating through all available comments using pagination. In each iteration, it appends the text of each comment to a list. The loop continues until there are no more comments to retrieve or an HTTP error occurs. Finally, it returns a pandas DataFrame containing detailed information about each comment, extracted from the API response.
from googleapiclient.discovery import build
from googleapiclient.errors import HttpError
from oauth2client.tools import argparser
from dotenv import load_dotenv
import os
import pandas as pd
from dotenv import load_dotenv

# Load environment variables from the .env file
load_dotenv()
# Set your API key
API_KEY = os.getenv('YOUTUBE_API_KEY', None)

if not API_KEY:
    raise AttributeError("YOUTUBE_API_KEY was not found in environment variables")

youtube = build('youtube', 'v3', developerKey=API_KEY)

def get_video_comments(video_id: str) -> pd.DataFrame:

    comments = []
    nextPageToken = None
    while True:
        try:
            response = youtube.commentThreads().list(
                part='snippet',
                videoId=video_id,
                maxResults=100,  # Adjust as needed
                pageToken=nextPageToken
            ).execute()

            # Extract comments
            for item in response['items']:
                comment = item['snippet']['topLevelComment']['snippet']['textDisplay']
                comments.append(item)

            # Check if there are more comments
            nextPageToken = response.get('nextPageToken')
            if not nextPageToken:
                break

        except HttpError as e:
            print('An HTTP error %d occurred:\n%s' % (e.resp.status, e.content))
            break

    return pd.DataFrame([x['snippet']['topLevelComment']['snippet'] for x in comments])
Natural Language Processing Script
Initial Setup
Firstly, we ensure that all necessary NLTK datasets are downloaded, including tokenizers, part-of-speech taggers, stopwords, and the WordNet lemmatizer. We also load the spaCy language model (en_core_web_sm), which is pre-trained and provides efficient NER capabilities.
Named Entity Recognition (NER)
The perform_named_entity_recognition function is at the heart of our script. It processes the input text using spaCy's language model to extract named entities along with their labels. Named entities can be people, organizations, locations, dates, and more. The function returns a list of tuples, where each tuple contains the entity text and its corresponding label.
import nltk
import spacy
import pandas as pd
from collections import Counter

# Ensure nltk datasets are downloaded
nltk.download('punkt')
nltk.download('averaged_perceptron_tagger')
nltk.download('stopwords')
nltk.download('wordnet')

# Load spacy language model
nlp = spacy.load('en_core_web_sm')


def perform_named_entity_recognition(text):
    """
    Perform named entity recognition (NER) on the given text.

    Args:
        text (str): The input text on which to perform NER.

    Returns:
        list: A list of tuples, where each tuple contains the entity text and its label.
    """
    # Use the Spacy language model to process the text
    doc = nlp(text)

    # Extract entities and their labels from the processed text
    # ent.text gives the entity text and ent.label_ gives the entity label (e.g., PERSON, ORG, GPE, etc.)
    entities = [(ent.text, ent.label_) for ent in doc.ents]

    # Return the list of entities and their corresponding labels
    return entities


def count_ner(entities):
    """
    Count the occurrences of each named entity type in the provided list of entities.

    Args:
        entities (list): A list of tuples, where each tuple contains the entity text and its label.

    Returns:
        dict: A dictionary with entity labels as keys and their counts as values.
    """
    ner_count = {}
    for entity, label in entities:
        ner_count[label] = ner_count.get(label, 0) + 1
    return ner_count


def count_entities(df, n=30):

    combined_ner = []

    for ner_list in df['ner_list']:
        combined_ner.extend(ner_list)

    counts_ner = Counter(combined_ner)
    top_entities = counts_ner.most_common(n=n)
    entities = [e for e,c in top_entities]
    counter = [c for e,c in top_entities]
    return entities, counter


def count_entity_type(df):
    # Combine counts from all rows
    combined_counts = {}
    for ner_count in df['ner_count']:
        for label, count in ner_count.items():
            combined_counts[label] = combined_counts.get(label, 0) + count

    labels = list(combined_counts.keys())
    counts = list(combined_counts.values())

    return labels, counts


# Apply NER counting to each row in the DataFrame
def extract_ner(entities):
    """
    Extract and lowercase named entities from the provided list of entities.

    Args:
        entities (list): A list of tuples, where each tuple contains the entity text and its label.

    Returns:
        list: A list of named entities in lowercase.
    """
    ner_list = [ent[0].lower() for ent in entities]  # Extract named entities
    return ner_list


def apply_ner_functions(df: pd.DataFrame, col='textDisplay') -> dict:
    """
    Apply NER-related functions to a specified column in the DataFrame.

    Args:
        df (pd.DataFrame): The input DataFrame.
        col (str): The name of the column on which to perform NER (default is 'textDisplay').

    Returns:
        pd.DataFrame: The DataFrame with additional columns for NER results.
    """
    # Apply the perform_named_entity_recognition function to the specified column
    df['ner'] = df[col].apply(perform_named_entity_recognition)

    # Apply the count_ner function to the 'ner' column to count entity occurrences
    df['ner_count'] = df['ner'].apply(count_ner)

    # Apply the extract_ner function to the 'ner' column to extract named entities
    df['ner_list'] = df['ner'].apply(extract_ner)

    # Return the modified DataFrame
    return df
By integrating NLTK and spaCy, this script offers a comprehensive approach to named entity recognition and analysis. It allows us to extract meaningful entities from text data, quantify their occurrences, and gain insights into the distribution of entities within a dataset. This process is crucial for various NLP applications, such as sentiment analysis, text classification, and information extraction.
Util Scripts
In this file for the time being we will just add two functions that allow us to switch between video id and url with ease, since the Youtube function we created previously expects a video id we need to clip the url to include only the id as shown in the convert_url_to_video_id method below.
#utils.py
def convert_url_to_video_id(url: str) -> str:
    return url.split('?')[-1][2:]

def video_id_to_url(video_id: str) -> str:
    return f'https://www.youtube.com/watch?v={video_id}'
Plotly Dash App
The script app.py sets up a comprehensive YouTube NLP Dashboard using Dash and Dash Bootstrap Components, designed to analyze and visualize comments from YouTube videos. The application allows users to input a YouTube video URL, retrieve comments from the video, and perform sentiment analysis and Named Entity Recognition (NER) on the comments. The layout includes an input field for the YouTube URL, a loading spinner, an AG-Grid to display the comments, and several Plotly graphs to visualize sentiment over time, sentiment distribution, and NER results. The VADER sentiment analyzer and spaCy are used for sentiment analysis and NER, respectively, while pandas handles data manipulation.
#app.py
import dash
import dash_bootstrap_components as dbc
from dash import dcc, html
from dash.dependencies import Input, Output, State
import plotly.graph_objs as go
import pandas as pd
import json
import dash_ag_grid as dag
from dash.exceptions import PreventUpdate


from youtube_scripts import get_video_comments
from utils import convert_url_to_video_id

from nlp_scripts import count_entity_type, apply_ner_functions, count_entities

from vaderSentiment.vaderSentiment import SentimentIntensityAnalyzer

# Initialize VADER sentiment analyzer
analyzer = SentimentIntensityAnalyzer()

# Initialize the Dash app with Bootstrap theme
app = dash.Dash(__name__, external_stylesheets=[dbc.themes.BOOTSTRAP])

# Define the layout of the app
app.layout = dbc.Container(
    fluid=True,
    style={
        'backgroundImage': 'url(https://example.com/dice-background.jpg)',  # Replace with your dice background URL
        'backgroundSize': 'cover',
        'height': '100vh',
        'textAlign': 'center',
        'paddingTop': '50px',
    },
    children=[
        dcc.Store(id='comments'),
        dcc.Store(id='video-id'),
        dbc.Row(
            dbc.Col(
                html.H1(
                    "YouTube NLP Dashboard",
                    style={'color': 'white', 'fontWeight': 'bold'}
                ),
                width=12
            ),
        ),
        dbc.Row(
            dbc.Col(
                dbc.InputGroup(
                    [
                        dbc.Input(id="video-url", placeholder="Enter YouTube video URL", type="text"),
                        dbc.Button("Submit", id="submit-url", color="primary", n_clicks=0),
                    ],
                    className="mb-3",
                ),
                width=6,
                className="mx-auto"
            ),
        ),
        dbc.Row(
            dbc.Col(
                dcc.Loading(
                    id="loading-spinner",
                    type="default",
                    children=html.Div(id="loading-output"),
                ),
                width=12
            ),
        ),
        dbc.Row(
            [
                dbc.Col(
                    [
                        dag.AgGrid(
                            id='comments-grid',
                            style={"height": "500px", "width": "100%"},
                            columnDefs=[
                                {"headerName": "Comment", "field": "textOriginal", "sortable": True, "filter": True, "tooltipField": "textOriginal"},
                                {"headerName": "Likes", "field": "likeCount", "sortable": True, "filter": True},
                                {"headerName": "Published At", "field": "publishedAt", "sortable": True, "filter": True},
                                {"headerName": "Sentiment", "field": "sentiment", "sortable": True, "filter": True}
                            ],
                            dashGridOptions={
                                "pagination": True,
                                "paginationPageSize": 10,
                                "enableBrowserTooltips": True  # Enable tooltips
                            }
                        ),
                    ],
                    width=6,
                    style={'padding': '10px'}
                ),
                dbc.Col(
                    html.Div(id='video-container'),
                    width=6,
                    style={'padding': '10px'}
                ),
            ]
        ),

           dbc.Row(
            [
                dbc.Col(
                    dcc.Graph(
                        id='sentiment-over-time',
                        figure={
                            'data': [{'x': [], 'y': [], 'type': 'bar', 'name': 'Placeholder'}],
                            'layout': {'title': 'Placeholder Chart 1'}
                        }
                    ),
                    width=6,
                    style={'padding': '10px'}
                ),
                dbc.Col(
                    dcc.Graph(
                        id='sentiment-histogram',
                        figure={
                            'data': [{'x': [], 'y': [], 'type': 'bar', 'name': 'Placeholder'}],
                            'layout': {'title': 'Placeholder Chart 2'}
                        }
                    ),
                    width=6,
                    style={'padding': '10px'}
                ),
            ]
        ),
        dbc.Row(
            [
                dbc.Col(
                    dcc.Graph(
                        id='name-entity-counts',
                        figure={
                            'data': [{'x': [], 'y': [], 'type': 'bar', 'name': 'Placeholder'}],
                            'layout': {'title': 'Placeholder Chart 1'}
                        }
                    ),
                    width=6,
                    style={'padding': '10px'}
                ),
                dbc.Col(
                    dcc.Graph(
                        id='top-30-named-entities',
                        figure={
                            'data': [{'x': [], 'y': [], 'type': 'bar', 'name': 'Placeholder'}],
                            'layout': {'title': 'Placeholder Chart 2'}
                        }
                    ),
                    width=6,
                    style={'padding': '10px'}
                ),
            ]
        )
    ]
)

# Callback to handle URL submission and store comments
@app.callback(
    [Output('comments', 'data'),
     Output('loading-output', 'children'),
     Output('submit-url', 'disabled'),
     Output('video-id', 'data')],
    [Input('submit-url', 'n_clicks')],
    [State('video-url', 'value')]
)
def update_comments(n_clicks, url):
    if n_clicks > 0 and url:
        video_id = convert_url_to_video_id(url)
        comments = get_video_comments(video_id)
        comments = apply_ner_functions(comments)
        comments['sentiment'] = comments['textDisplay'].apply(lambda x: analyzer.polarity_scores(x)['compound'])
        return comments.to_dict(orient='records'), "", False, video_id
    return None, "", False, None

# Callback to update video iframe
@app.callback(
    Output('video-container', 'children'),
    [Input('video-id', 'data')]
)
def update_video_container(video_id):
    if video_id:
        iframe = html.Iframe(
            src=f"https://www.youtube.com/embed/{video_id}",
            style={"width": "100%", "height": "500px", "border": "none"}
        )
        return iframe
    return ""

# Callback to update the AG-Grid with comments
@app.callback(
    Output('comments-grid', 'rowData'),
    [Input('comments', 'data')]
)
def update_comments_grid(data):
    if data:
        return data
    return []


@app.callback(
        Output('sentiment-over-time', 'figure'),
        Output('sentiment-histogram', 'figure'),
        Input('comments',
              'data')
)
def plot_sentiment_charts(data):

    if not data:
        raise PreventUpdate

    data = pd.DataFrame(data)
    data.index = pd.to_datetime(data.publishedAt)

    data['sentiment_through_time'] = data['sentiment'].rolling(20).mean()
    # make the sentiment over time plot
    fig_1 = go.Figure()
    fig_1.add_trace(go.Scatter(x=data.index, y=data['sentiment_through_time'], mode='lines+markers', name='Sentiment'))
    fig_1.update_layout(
        title='Sentiment Over Time',
        xaxis_title='Time',
        yaxis_title='Sentiment',
        template='plotly'
    )
     # Create the sentiment histogram
    fig_2 = go.Figure()
    fig_2.add_trace(go.Histogram(x=data['sentiment'], nbinsx=20))
    fig_2.update_layout(
        title='Sentiment Distribution',
        xaxis_title='Sentiment',
        yaxis_title='Frequency',
        template='plotly'
    )

    return fig_1, fig_2


# Callback to update the graphs
@app.callback(
    [Output('name-entity-counts', 'figure'),
     Output('top-30-named-entities', 'figure')],
    [Input('comments', 'data')]
)
def update_comment_figures_row_2(data):
    if data:
        data = pd.DataFrame(data)

        # Top entities
        labels, counts = count_entities(df=data)

        # Create the Plotly bar chart
        fig_topn = go.Figure()

        fig_topn.add_trace(go.Bar(
            y=labels,
            x=counts,
            orientation='h',
            marker=dict(color='skyblue')
        ))

        # Update layout
        fig_topn.update_layout(
            title=f'Top {len(counts)} Named Entities',
            xaxis_title='Count',
            yaxis_title='Named Entity',
            yaxis=dict(autorange='reversed'),  # Invert y-axis to display top entities at the top
            margin=dict(l=40, r=40, t=40, b=40)
        )

        # Entity type counts
        labels, counts = count_entity_type(df=data)

        fig_entity_type = go.Figure()

        fig_entity_type.add_trace(go.Bar(
            y=labels,
            x=counts,
            orientation='h',
            marker=dict(color='lightgreen')
        ))

        # Update layout
        fig_entity_type.update_layout(
            title=f'Entity Type Counts',
            xaxis_title='Count',
            yaxis_title='Entity Type',
            yaxis=dict(autorange='reversed'),  # Invert y-axis to display top entities at the top
            margin=dict(l=40, r=40, t=40, b=40)
        )

        return fig_entity_type, fig_topn
    return {}, {}

if __name__ == '__main__':
    app.run_server(debug=True, port=8050)
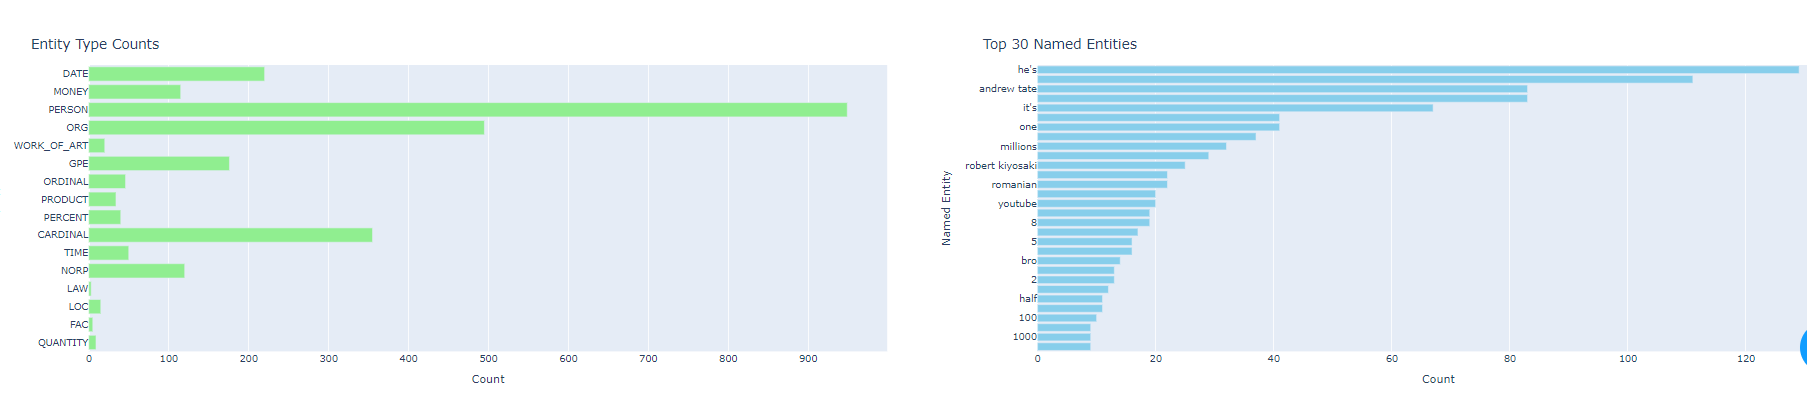
The app features multiple callbacks to handle user interactions and data updates. Upon submitting a YouTube URL, the app retrieves and processes the comments, storing them in the Dash Store component. The comments are then displayed in an AG-Grid, and sentiment analysis results are plotted in graphs showing sentiment over time and distribution. Additional graphs display counts of different named entities and their types, providing insights into the most common entities mentioned in the comments. This dynamic and interactive dashboard is ideal for visualizing and understanding viewer feedback on YouTube videos.
In this project, we demonstrate the combined power of Natural Language Processing (NLP), the YouTube API, and Plotly Dash with pandas for data analysis within an intuitive and visually appealing user interface. By leveraging the YouTube API, we retrieve comments from videos, apply NLP techniques using spaCy and VADER for sentiment analysis and Named Entity Recognition, and utilize pandas for efficient data manipulation. The results are then beautifully visualized using Plotly Dash, creating an interactive dashboard that allows users to gain valuable insights into viewer sentiment and key topics discussed in the comments.