📊 Data Is Everything in Crypto Algo Trading
When it comes to building an algorithmic trading bot in the crypto space 🧠, there’s nothing more important than data. Whether it’s 1-minute OHLC bars or live order book snapshots, data is the key ingredient. Every single decision your bot makes relies on timely⏱️, accurate info — so if you're just getting started, getting your head around market data is a must. Master the data, and you're well on your way to building a solid trading system ⚙️
📚 Contents
🔹 Get Historical OHLC Prices – Pull time series data for any symbol on Bybit (spot or futures).
🔹 Get Crypto Statistics & Futures Symbols – Retrieve metadata, stats, and all active trading pairs.
🔹 Make an OHLC Financial Plot with mplfinance – Visualize your market data like a pro 📊.
🔹 Save Data to Disk – Easily store your datasets for future use or backtesting 💾.
🔹Convert OHLC data to new time interval – Change 1min OHLC to 5 min , 60min to daily etc 📉

We’re building on what we covered in the previous two posts — where we walked through getting started with algo trading and setting up your Bybit API key 🔑. Now that you've got your environment ready and your keys in place, it’s time to start working with real market data and laying the groundwork for your trading bot 🚀.
Get Futures Tickers Bybit
Knowing which symbols are currently active is a key ingredient in building a successful trading bot. In this section, we’ll create a simple helper method to fetch a list of live Bybit linear contracts, giving us a snapshot of the latest price, along with useful metrics like 24h volume, funding rate, open interest, and 24h price change. 🧠⚙️
These real-time stats are essential for making smart trading decisions, monitoring volatility, and filtering for the most liquid or trending markets.
As shown in the previous post, we can easily import our client helper to get an HTTP object, which lets us make authenticated API requests in just a few lines of code.
from helpers.get_bybit_http import get_client

# For Demo trading
client = get_client(testnet=True)

# For Live Trading
client = get_client(testnet=False)
To collect historical data from Bybit, there are a few key parameters we need to define before calling the API. For this demo, we’ll be working with USDT perpetual futures contracts, so the category we’ll be using is 'linear'.
Since the vast majority of active contracts on Bybit (over 500 🔥) are USDT-based, we’ll stick with those for this example
Bybit also offers spot and inverse contracts, so it's important to make sure you select the right category depending on the type of market you're working with:
⚡Let's get stuck straight in with some code to retrieve the tickers.
result = client.get_tickers(category='linear')

tickers = result.get('result', {}).get('list', [])

print(tickers)
This will print out a total list of which linear perps Bybit currently offer. Users can then select an asset to download historical data in the next section.
{'symbol': '10000000AIDOGEUSDT', 'lastPrice': '0.0007039', 'indexPrice': '0.0007048', 'markPrice': '0.0007039', 'prevPrice24h': '0.0007884', 'price24hPcnt': '-0.107179', 'highPrice24h': '0.0007902', 'lowPrice24h': '0.0006617', 'prevPrice1h': '0.0006871', 'openInterest': '310300000', 'openInterestValue': '218420.17', 'turnover24h': '571882.5140', 'volume24h': '799396600.0000', 'fundingRate': '0.00002009', 'nextFundingTime': '1744012800000', 'predictedDeliveryPrice': '', 'basisRate': '', 'deliveryFeeRate': '', 'deliveryTime': '0', 'ask1Size': '10500', 'bid1Price': '0.0007037', 'ask1Price': '0.0007039', 'bid1Size': '10700', 'basis': '', 'preOpenPrice': '', 'preQty': '', 'curPreListingPhase': ''}


There are a total of 563 from API
Convert to Pandas DataFrame
Pandas is an essential package when it comes to creating bots with Python. Ensure you have it pip installed and then run the following ⬇️
import pandas as pd

ticker_df = pd.DataFrame(tickers)
ticker_df
As shown in the image below ⬇️, this gives us a dataframe with all the symbols and all the latest price data from Bybit.
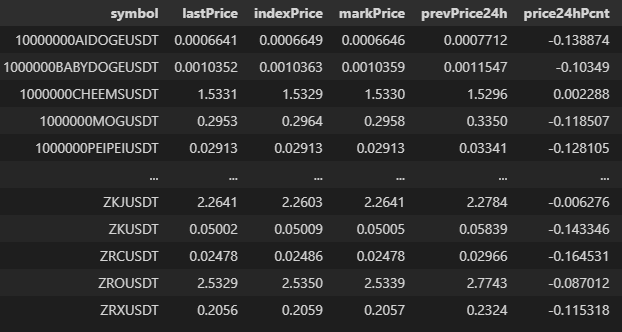
With just one API call, our Python script pulled over 500 symbols — including open interest, funding rates, and best bid/ask data. It’s a powerful method and one of the most useful tools in our algo trading toolkit.
'''
Index(['symbol', 'lastPrice', 'indexPrice', 'markPrice', 'prevPrice24h',
       'price24hPcnt', 'highPrice24h', 'lowPrice24h', 'prevPrice1h',
       'openInterest', 'openInterestValue', 'turnover24h', 'volume24h',
       'fundingRate', 'nextFundingTime', 'predictedDeliveryPrice', 'basisRate',
       'deliveryFeeRate', 'deliveryTime', 'ask1Size', 'bid1Price', 'ask1Price',
       'bid1Size', 'basis', 'preOpenPrice', 'preQty', 'curPreListingPhase'],
      dtype='object')
'''
It’s probably a good idea to pick one of the 500 symbols from the dataframe to test the next section on retrieving historical OHLC data. I am going to start with getting some free ETH data from the API to test it out.
Get Historical OHLC Data
Once we’ve chosen a USDT perpetual contract, we can move on to collecting historical data. The table below outlines the key parameters required to do this. Note that the interval parameter refers to data frequency — for example, 1 means 1-minute candles.
This is why having a full and accurate list of available Bybit symbols is so important. For this section, we’ll be working with the Bybit Kline endpoint, which provides access to historical price data.
Let’s start by looking at the arguments the API expects.
Request Arguments
The table below shows the response parameters , the function format_data above extracts the information in the list from the API and formats them in to a pandas dataframe.
🐍 Python Code to get Daily OHLC for ETH
The Python script below uses the get_kline method from Pybit. Since we’re not passing any start or end timestamps and have set the interval to 'D', the API will return the latest 200 daily OHLC bars by default.
response = client.get_kline(category='linear',
                             symbol='ETHUSDT',
                             interval='D').get('result', {}).get('list', [])

def format_data(data_list) -> pd.DataFrame:

    if not data_list:
        return pd.DataFrame()

    data = pd.DataFrame(data_list,
                        columns =[
                            'timestamp',
                            'open',
                            'high',
                            'low',
                            'close',
                            'volume',
                            'turnover'
                            ],
                        )
    data.index = pd.to_datetime(data.timestamp.astype(int), unit='ms', utc=True)
    return data[::-1].apply(pd.to_numeric)

df = format_data(response)

print(df)


'''
                              timestamp     open     high      low    close  \
timestamp
2024-09-20 00:00:00+00:00  1726790400000  2464.43  2571.34  2436.45  2560.85
2024-09-21 00:00:00+00:00  1726876800000  2560.85  2621.73  2527.56  2611.25
2024-09-22 00:00:00+00:00  1726963200000  2611.25  2632.68  2522.74  2580.01
2024-09-23 00:00:00+00:00  1727049600000  2580.01  2702.89  2538.23  2645.75
2024-09-24 00:00:00+00:00  1727136000000  2645.75  2672.43  2590.01  2652.70
...                                  ...      ...      ...      ...      ...
2025-04-03 00:00:00+00:00  1743638400000  1794.27  1844.51  1747.44  1816.29
2025-04-04 00:00:00+00:00  1743724800000  1816.29  1835.00  1757.39  1816.08
2025-04-05 00:00:00+00:00  1743811200000  1816.08  1827.08  1762.71  1804.99
2025-04-06 00:00:00+00:00  1743897600000  1804.99  1816.68  1535.83  1579.98
2025-04-07 00:00:00+00:00  1743984000000  1579.98  1613.53  1410.12  1494.22

'''
⚡ 15 min OHLC for BTC
The issue with this approach is that we’re limited to just 200 rows of data per call. So, if we want data going back further — which we usually do when researching trading strategies, we are going to need to loop over a range of dates and get the open high low close bars incrementally. The script below gets the OHLC bars for BTCUSDT linear perpetual contract.
import datetime as dt
import time

def get_last_timestamp(df):
    return int(df.timestamp[-1:].values[0])

start = int(dt.datetime(2022, 1, 1, tzinfo=dt.timezone.utc).timestamp()* 1000)

interval = 15
symbol = 'BTCUSDT'
df = pd.DataFrame()

while True:
    response = client.get_kline(category='linear',
                                 symbol=symbol,
                                 start=start,
                                 interval=interval, limit=1000)

    latest = format_data(response.get('result', {}).get('list',[]))
    start = get_last_timestamp(latest)
    time.sleep(0.01)
    df = pd.concat([df, latest])
    print(f'Collecting data starting {dt.datetime.fromtimestamp(start/1000)}')
    if len(latest) == 1: break


df.drop_duplicates(subset=['timestamp'], keep='last', inplace=True)

'''
Collecting data starting 2022-01-11 09:45:00
Collecting data starting 2022-01-21 19:30:00
Collecting data starting 2022-02-01 05:15:00
Collecting data starting 2022-02-11 15:00:00
Collecting data starting 2022-02-22 00:45:00
Collecting data starting 2022-03-04 10:30:00
Collecting data starting 2022-03-14 20:15:00
Collecting data starting 2022-03-25 06:00:00
Collecting data starting 2022-04-04 15:45:00
Collecting data starting 2022-04-15 01:30:00
Collecting data starting 2022-04-25 11:15:00
'''
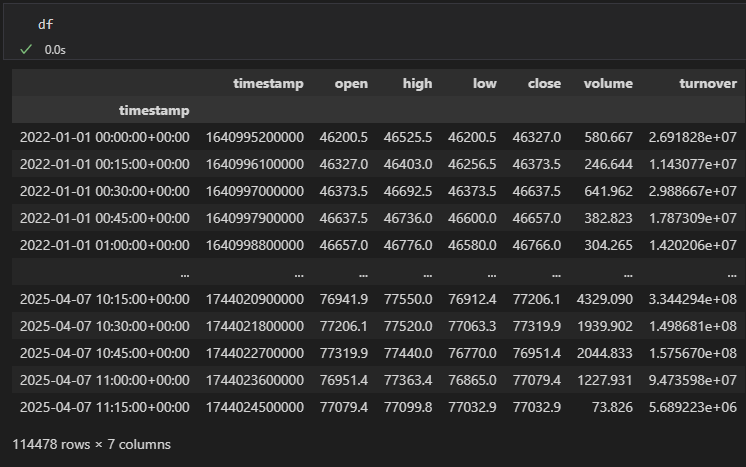
In less than 20 seconds, the script above downloads over 100,000 OHLC bars for BTC — all for free! ⚡
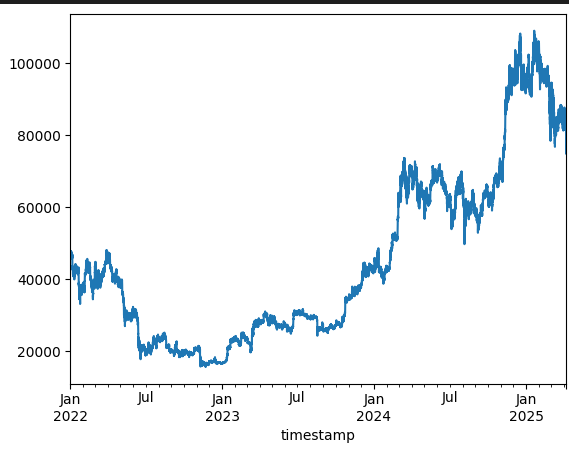
Let's plot the BTC data we got from the API with matplotlib.
df.close.plot()
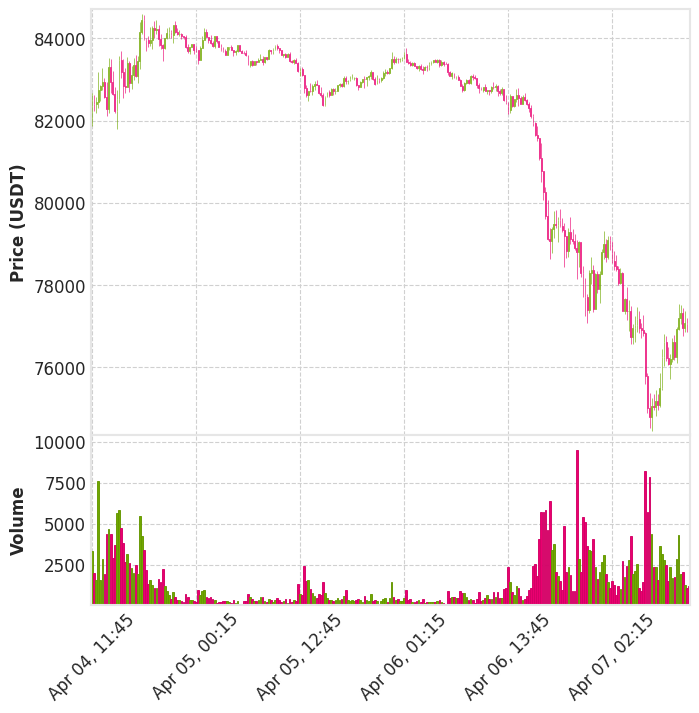
📉 Making Financial Style Plot Matplotlib
Since we have gone to all that effort to download this BTC futures data, it seems a good idea to make a nice financial style OHLC plot to compare it to the charts we may see from Tradingview or from the Bybit UI. To achive this we will install mplfinance package we can easily install this package with pip and have professional financial charts created in a matter of seconds.
import mplfinance as mpf

days_look_back = 3 * 24* 4 # 4 15 mins in 1 hour, 24 hours in 1 day , plot 7 days
ohlc_df = df[['open', 'high', 'low', 'close', 'volume']][-days_look_back:]

# Plot with style
mpf.plot(
    ohlc_df,
    type='candle',
    volume=True,
    style='binance',
    ylabel='Price (USDT)',
    figratio=(6, 6),
    figscale=1.2,
    tight_layout=True
)
Advanced Data Tips for Algo Traders
Save OHLC Data To CSV
When you’re researching quantitative strategies, it gets a bit of a pain having to download the data every time you want to run a backtest or try out a new trading idea. That’s why it’s a good idea 💡 to save the data to disk — then you can just load it straight in with pandas whenever you need it 😎.
We’ve created a folder called data, and we’ll save the 15-minute OHLC bars into that folder as a CSV using the command below:
## save the data to csv
df.to_csv('data/BTCUSDT_15min.csv', index=False)
You should now see the data saved in the data folder.
![]()
Then we can always come back and instantly load the data.
## we can then come back to this notebook later and load data back in
import pandas as pd

df = pd.read_csv('data/BTCUSDT_15min.csv')
df.index = pd.to_datetime(df.timestamp, unit='ms', utc=True)

df.sort_index(inplace=True)
How to Convert OHLC Data to Different Time Intervals (1min, 5min, 1h, etc.)
When we’re researching strategies , we might want to test them on lots of different time intervals — and with 10+ interval options available, downloading separate data for each one (like 1min, 5min, 60min, etc.) would be way too slow and annoying ⏳😩.
Instead, we can use a super handy pandas function to resample OHLC data 🔁. This lets us convert lower timeframe data into higher ones — think 15min ➡️ hourly, or hourly ➡️ daily. Just keep in mind, it only really works in that direction (can’t go backwards in time... ⏱️).
VALID_RESAMPLE_INTERVALS = ["1min", "5min", "15min", "30min", "h", "D", "W"]


def resample_bybit_ohlc(df: pd.DataFrame, new_interval: str) -> pd.DataFrame:
    if new_interval not in VALID_RESAMPLE_INTERVALS:
        raise ValueError(
            f"'{new_interval}' is not a valid interval. Must be one of {VALID_RESAMPLE_INTERVALS}."
        )
    resampled_list = []
    agg_dict = {
        "open": "first",  # take the first price for new open
        "high": "max",  # take the max price for new high
        "low": "min",  # take the min price for new low
        "close": "last",  # take the last price for new close
        "volume": "sum",  # take sum over interval for new volume
        "turnover": "sum",  # take sum over interval for new turnover
    }
    return df.resample(new_interval).agg(agg_dict)
Since the sample data we downloaded is in 15 minute intervals, let's test out converting this in to hourly and daily data.
hourly = resample_bybit_ohlc(df=df, new_interval='h')
daily = resample_bybit_ohlc(df=df, new_interval='D')

print(daily)
'''

                            open     high      low    close      volume  \
timestamp
2022-01-01 00:00:00+00:00  46200.5  47915.5  46200.5  47719.5   34577.530
2022-01-02 00:00:00+00:00  47719.5  48000.0  46600.0  47305.0   36773.655
2022-01-03 00:00:00+00:00  47305.0  47576.5  45700.0  46462.0   44821.196
2022-01-04 00:00:00+00:00  46462.0  47475.0  45500.0  45870.0   54528.894
2022-01-05 00:00:00+00:00  45870.0  47060.0  42444.0  43437.0   88336.716
...                            ...      ...      ...      ...         ...
2025-04-03 00:00:00+00:00  82468.1  83888.0  81146.0  83175.2  112771.731
2025-04-04 00:00:00+00:00  83175.2  84736.0  81605.0  83862.1  177059.417
2025-04-05 00:00:00+00:00  83862.1  84244.0  82343.0  83496.7   45495.798
2025-04-06 00:00:00+00:00  83496.7  83774.3  77083.5  78376.1  136446.269
2025-04-07 00:00:00+00:00  78376.1  79315.8  74456.2  77174.8  122062.143

'''
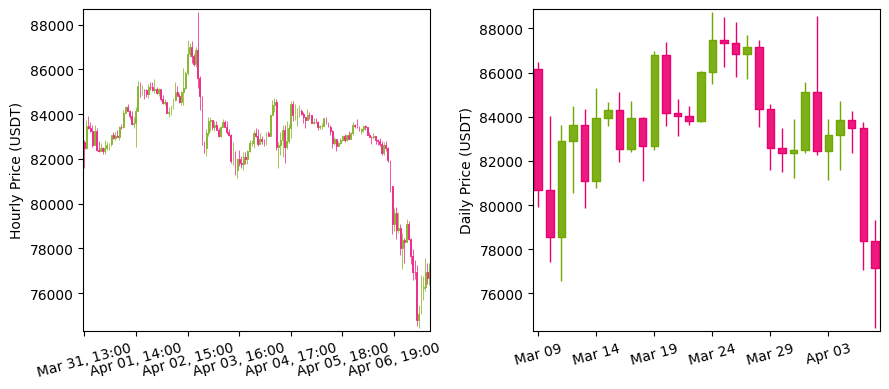
Ok great, that will save us a lot of time, let's plot the charts just to make sure they are as we expect
import matplotlib.pyplot as plt
import mplfinance as mpf

# Resample the data
hourly = resample_bybit_ohlc(df=df, new_interval='h').tail(24*7)  # last 7 days of hourly
daily = resample_bybit_ohlc(df=df, new_interval='D').tail(30)     # last 30 daily candles

fig, (ax1, ax2) = plt.subplots(1, 2, figsize=(9, 4), dpi=100)

# Plot hourly data
mpf.plot(
    hourly,
    type='candle',
    ax=ax1,
    style='binance',
    ylabel='Hourly Price (USDT)',
    tight_layout=True,
    xrotation=15
)

# Plot daily data
mpf.plot(
    daily,
    type='candle',
    ax=ax2,
    style='binance',
    ylabel='Daily Price (USDT)',
    tight_layout=True,
    xrotation=15
)

plt.tight_layout()
plt.show()
In the next post, we’ll show how to get indicator data with Python 📈. The entire code can be found at the link below ⬇️
🚀 Bybit Python Tools
A clean, modular toolkit for algo trading on Bybit using Python. Includes helper methods, API key management, and more.
View on GitHub