📊 Intro: Going Beyond Price with Market Sentiment
Learn how to access key cryptocurrency market sentiment metrics like open interest (OI) and the long/short ratio using Python and the Bybit API.
In this post, we’ll walk through a complete guide to pulling both OI and long/short ratio data — ideal for building smarter crypto trading bots 🤖.
So, why do we need this data? Because relying only on basic OHLC price data (like we covered in the previous post) often isn't enough to give you a real edge. To build a profitable trading bot, we need to dig deeper into trader behavior — and these two metrics are excellent tools for spotting crowd sentiment and momentum shifts in the market.

📈 What is Open Interest?
Open interest is just the number of active futures contracts still open — not yet closed or settled. Simple as that.
We can use it to gauge market sentiment and momentum 🔍. If OI is rising with price, it usually means strong conviction 💪. If it’s falling, traders might be backing off 😬.
Get OI Data with Python🐍
Here, we’ll use the same get_client method from the previous post, and download, format, and resample the data just like we did with the OHLC section 📊. Easy reuse, same smooth process 💡. We will get BTC open interest, note that this will return a figure that represents that total number of BTC outstanding, i.e. 10,000 OI values means 10k BTC open contracts.
from helpers.get_bybit_http import get_client
import pandas as pd
import matplotlib.pyplot as plt
import datetime as dt

client = get_client(testnet=False)

response = client.get_open_interest(
    category="linear",
    symbol="BTCUSDT",
    intervalTime="1h",
    limit=200
).get('result', {}).get('list', [])

response
1️⃣ This returns a list of dictionaries, each containing openInterest and a UTC timestamp ⏱️
[{'openInterest': '51388.99800000', 'timestamp': '1744030800000'},
 {'openInterest': '50582.16900000', 'timestamp': '1744027200000'},
 {'openInterest': '50717.87800000', 'timestamp': '1744023600000'},
 {'openInterest': '51039.16000000', 'timestamp': '1744020000000'},
 {'openInterest': '50855.31900000', 'timestamp': '1744016400000'},
 {'openInterest': '50662.22800000', 'timestamp': '1744012800000'},
 {'openInterest': '50074.49600000', 'timestamp': '1744009200000'},
 {'openInterest': '52941.12400000', 'timestamp': '1744005600000'},
 {'openInterest': '52412.42300000', 'timestamp': '1744002000000'},
 {'openInterest': '52814.07300000', 'timestamp': '1743998400000'},
 {'openInterest': '52426.93900000', 'timestamp': '1743994800000'}]
2️⃣ Let’s convert it to a pandas DataFrame to make the data easier to analyse and work with
def format_bybit_oi(response: list[dict]) -> pd.DataFrame:
    if not response:
        return pd.DataFrame()
    df = pd.DataFrame(response)
    df['timestamp'] = df.timestamp.astype(int)
    df['openInterest'] = df.openInterest.astype(float)
    df.index = pd.to_datetime(df.timestamp, unit='ms', utc=True)
    return df.sort_index()

oi_data = format_bybit_oi(response=response)
oi_data


'''

	openInterest	timestamp
timestamp
2025-03-30 06:00:00+00:00	52745.154	1743314400000
2025-03-30 07:00:00+00:00	52641.994	1743318000000
2025-03-30 08:00:00+00:00	52717.180	1743321600000
2025-03-30 09:00:00+00:00	52896.121	1743325200000
2025-03-30 10:00:00+00:00	52970.271	1743328800000

'''
Download & Save All Open Interest Data for Symbol
Getting open interest data from Bybit can be a bit annoying 😅 — the required arguments are slightly different, and the way they handle start and end timestamps isn’t exactly intuitive 🧩.
That said, let’s go ahead and download the BTC open interest data so we can match it up nicely with the OHLC data we pulled in the last post 🔁
import time

def get_last_timestamp(df):
    return int(df.timestamp[-1:].values[0])

def increment_oi_timestamp(
    start_ts: int, unit: str, n_units: int
) -> int:
    increments = {
        "1min": 60 * 1000,
        "5min": 5 * 60 * 1000,
        "15min": 15 * 60 * 100,
        "30min": 30 * 60 * 1000,
        "1h": 60 * 60 * 1000,
        "4h": 4 * 60 * 60 * 100,
        "D": 24 * 60 * 60 * 1000,
    }
    new_ts = increments[unit] * n_units + start_ts
    return new_ts


start = int(dt.datetime(2022, 1, 1, tzinfo=dt.timezone.utc).timestamp()* 1000)

interval = "15min"
symbol = 'BTCUSDT'
all_oi = pd.DataFrame()
end = increment_oi_timestamp(start_ts=start, unit=interval, n_units=199)
while True:
    response = client.get_open_interest(category='linear',
                                 symbol=symbol,
                                 startTime=start,
                                 endTime=end,
                                 intervalTime=interval, limit=200)

    latest = format_bybit_oi(response.get('result', {}).get('list',[]))
    start = get_last_timestamp(latest)
    end = increment_oi_timestamp(start_ts=start, unit=interval, n_units=199)
    time.sleep(0.01)
    all_oi = pd.concat([all_oi, latest])
    print(f'Collecting data starting {dt.datetime.fromtimestamp(start/1000)}')
    if len(latest) == 1: break


all_oi.drop_duplicates(subset=['timestamp'], keep='last', inplace=True)
You should see a printout similar to below ⬇️
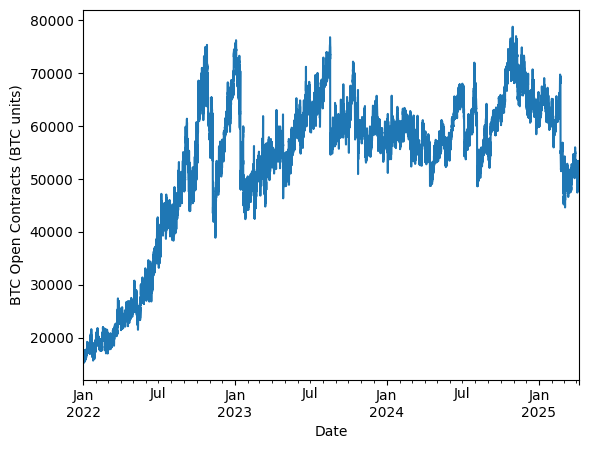
Let's plot the data
all_oi['openInterest'].plot()
plt.xlabel('Date')
plt.ylabel('BTC Open Contracts (BTC units)')
## save open interest data to same folder as OHLC
all_oi.to_csv('data/BTC_USDT_OI_15min.csv', index=False)
Change OI Time Interval
Let’s say we want to change the interval — just like we did with the OHLC data in the last post🔁. For example, if we want to resample from 15-minute data to daily, we need to be careful.
Since Open Interest (OI) is a snapshot, not an aggregated metric like OHLC, we should simply take the first observation for each time period 🕒📸 — not the mean, sum, or anything else.
## resample to different timeframe
VALID_RESAMPLE_INTERVALS = ["1min", "5min", "15min", "30min", "h", "D", "W"]
def resample_bybit_oi(df: pd.DataFrame, new_interval: str) -> pd.DataFrame:
    return df.resample(new_interval).agg({
        "timestamp": "first",
        "openInterest": "first"
    })

oi_daily = resample_bybit_oi(df=all_oi, new_interval='D')
print(oi_daily)

'''

                              timestamp  openInterest
timestamp
2022-01-01 00:00:00+00:00  1640995200000     15863.152
2022-01-02 00:00:00+00:00  1641081600000     15636.474
2022-01-03 00:00:00+00:00  1641168000000     15370.184
2022-01-04 00:00:00+00:00  1641254400000     17275.287
2022-01-05 00:00:00+00:00  1641340800000     15976.977
...                                  ...           ...
2025-04-03 00:00:00+00:00  1743638400000     49369.163
2025-04-04 00:00:00+00:00  1743724800000     48211.773
2025-04-05 00:00:00+00:00  1743811200000     50905.811
2025-04-06 00:00:00+00:00  1743897600000     50464.327
2025-04-07 00:00:00+00:00  1743984000000     52375.214

[1193 rows x 2 columns]
'''
📈 What is the Long-Short Ratio ?📉
📊 Long/Short Account Ratios Explained
- Long Account Ratio = No. of holders with long positions / Total no. of holders
- Short Account Ratio = No. of holders with short positions / Total no. of holders
- Long/Short Ratio = Long Account Ratio / Short Account Ratio
It goes without saying — this is a fantastic tool for gauging crypto market sentiment 🧠. It gives us insight into how many traders are positioned long vs short.
That said, a very high long ratio can also be a warning sign 🚨 — it might mean the market is getting overheated as if everyone is already long then maybe not many new buyers can enter the market.
Get Long Short Ratio with Python🐍
This endpoint is very similar to the open interest one 🔁
peiod = "15min"
symbol = 'BTCUSDT'
end = increment_oi_timestamp(start_ts=start, unit='15min', n_units=199)
response =client.get_long_short_ratio(category='linear', symbol=symbol, period=interval, limit=500)


response.get('result',{}).get('list',[])

'''
[{'symbol': 'BTCUSDT',
  'buyRatio': '0.5357',
  'sellRatio': '0.4643',
  'timestamp': '1641012300000'}]
From this, we get back a list of dictionaries, each containing the latest long/short account ratio data .
Now, let’s go ahead and fetch all the long/short ratio data for the BTCUSDT futures contract on Bybit. This will give us a clearer picture of trader positioning over time — super useful for sentiment analysis and strategy building towards a profitable trading bot🔍.
## get all long short ratio
def format_long_short_ratio(response: list[dict]) -> pd.DataFrame:
if not response:
return pd.DataFrame()
df = pd.DataFrame(response)
df['buyRatio'] = df.buyRatio.astype(float)
df['sellRatio'] = df.sellRatio.astype(float)
df['long_short_ratio'] = df.buyRatio / df.sellRatio
df['timestamp'] = df.timestamp.astype(int)
df.index = pd.to_datetime(df.timestamp, unit='ms', utc=True)
return df.sort_index()
start = int(dt.datetime(2022, 1, 1, tzinfo=dt.timezone.utc).timestamp()* 1000)
peiod = "15min"
symbol = 'BTCUSDT'
all_long_short = pd.DataFrame()
end = increment_oi_timestamp(start_ts=start, unit='15min', n_units=199)
while True:
response = client.get_long_short_ratio(category='linear',
symbol=symbol,
startTime=start,
endTime=end,
period=interval, limit=500)
latest = format_long_short_ratio(response.get('result', {}).get('list',[]))
start = get_last_timestamp(latest)
end = increment_oi_timestamp(start_ts=start, unit=interval, n_units=199)
time.sleep(0.01)
all_long_short = pd.concat([all_long_short, latest])
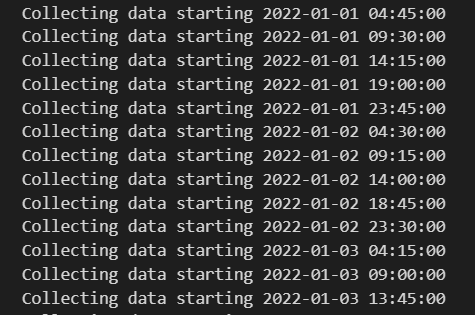
print(f'Collecting data starting {dt.datetime.fromtimestamp(start/1000)}')
if len(latest) == 1: break
all_long_short.drop_duplicates(subset=['timestamp'], keep='last', inplace=True)
'''
Collecting data starting 2022-01-01 04:45:00
Collecting data starting 2022-01-01 09:30:00
Collecting data starting 2022-01-01 14:15:00
Collecting data starting 2022-01-01 19:00:00
Collecting data starting 2022-01-01 23:45:00
Collecting data starting 2022-01-02 04:30:00
Collecting data starting 2022-01-02 09:15:00
Collecting data starting 2022-01-02 14:00:00
Collecting data starting 2022-01-02 18:45:00
Collecting data starting 2022-01-02 23:30:00
'''
Save the data to the data folder we have created.
## 💾 to disk
all_long_short.to_csv('data/BTCUSDT_long_short_15min.csv', index=False)
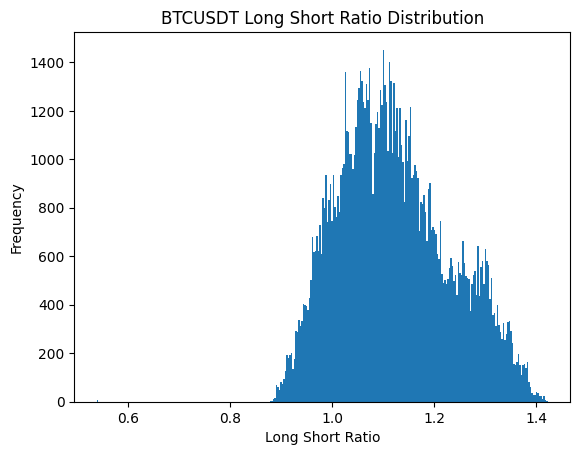
Plot the distribution of the ratio
all_long_short.long_short_ratio.plot.hist(bins=300)
plt.title(f"BTCUSDT Long Short Ratio Distribution")
plt.xlabel(f"Long Short Ratio")
plt.ylabel(f"Frequency")

🚀 Bybit Python Tools
A clean, modular toolkit for algo trading on Bybit using Python. Includes helper methods, API key management, and more.
View on GitHub